Top Menu

Tuesday, April 27, 2010

Pointing DataView to List Name (Not List GUIID)


I had a requirement to display items from a Document library in DataView WebPart and tricky part was to make it portable, so that everytime a site template is created and restored somewhere else, the DataView should not crash.

Solution:
Change the following XSL for DataView WebPart:
1. Update Name="ListID" to Name="ListName"
2. Update ParameterKey="ListID" to ParameterKey="ListName"
3. Update DefaultValue="GUID" to DefaultValue="[List Name]"
in SelectParameters, DeleteParameters, UpdateParameters, InsertParameters and ParameterBindings tags.

<selectparameters>
 <webpartpages:dataformparameter defaultvalue="Components" name="ListName" parameterkey="ListName" propertyname="ParameterValues">
</webpartpages:dataformparameter></selectparameters>

<deleteparameters>
 <webpartpages:dataformparameter defaultvalue="Components" name="ListName" parameterkey="ListName" propertyname="ParameterValues">
</webpartpages:dataformparameter></deleteparameters>

<updateparameters>
 <webpartpages:dataformparameter defaultvalue="Components" name="ListName" parameterkey="ListName" propertyname="ParameterValues">
</webpartpages:dataformparameter></updateparameters>

<insertparameters>
 <webpartpages:dataformparameter defaultvalue="Components" name="ListName" parameterkey="ListName" propertyname="ParameterValues">
</webpartpages:dataformparameter></insertparameters>

<parameterbinding defaultvalue="Components" location="None" name="ListName">
</parameterbinding>

Thursday, April 15, 2010

Intractive SharePoint Charts with No Code

Recently I came across this amazing article of Claudio (http://www.endusersharepoint.com/2009/04/20/finally-dynamic-charting-in-wss-no-code-required/) about displaying the graphs from a SharePoint list data without writing any code (of course JavaScript is code but we are referring to C# here ;o)). It shows how you can display pie-chart (Google Charts) with a small JavaScript code added to CEWP which works on your SharePoint Data.


I have extended the same technique (JavaScript) to display the Interactive Google Charts based on the SharePoint Data without writing any code :o). The javascript code uses JQuery and Google Interactive Charts (aka Visualization API).
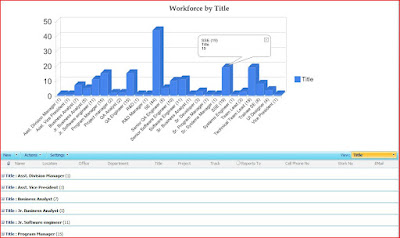
You need to perform following steps:
1. Create a new SharePoint List View.
2. Group the data by a Column e.g. Title.
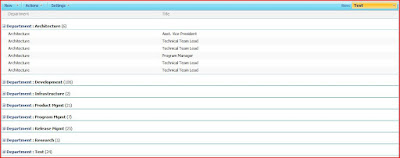
3. Add Content Editor WebPart
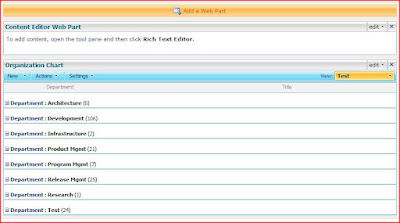
4. Select Edit-> Modify Shared WebPart -> Source Editor and paste the following JavaScript:

<!--
Author: Tahir Naveed
Date: 2010-04-15
Article URL:http://mysplist.blogspot.com/2010/04/intractive-sharepoint-charts-with-no.html
Blog URL: http://mysplist.blogspot.com/
Original Code: http://www.endusersharepoint.com/2009/04/29/finally-dynamic-charting-in-wss-no-code-required-part-3-multiple-pie-charts
-->
<SCRIPT type=text/javascript>
if(typeof jQuery=="undefined")
{
    var jQPath="http://ajax.googleapis.com/ajax/libs/jquery/1.3.2/";
    document.write("<script src='",jQPath,"jquery.js' type='text/javascript'><\/script>");
}
</SCRIPT>

<script type="text/javascript" src="http://www.google.com/jsapi">
</script> 

<SCRIPT type=text/javascript>
var ColValue = new Array();
var ColName = new Array();

// Getting the Data
$("document").ready(function(){
 var arrayList=$("td.ms-gb:contains(':')");
 var coord= new Array();
 var labels= new Array();
 $.each(arrayList, function(i,e)
 {
  var MyIf= $(e).text();
  var txt= MyIf.substring(MyIf.indexOf('(')+1,MyIf.length-1); 
  // Extract the 'Y' coordinates
  coord[i]=txt;
  var txt1= MyIf.substring(MyIf.indexOf(':')+2,MyIf.indexOf("(")-1); 
  // Extract the labels
  labels[i]=txt1+"("+txt+")";   
  //add also coordinates for better read
 });
 ColValue = coord;
 ColName = labels;
 });

//Graph Rendering
google.load("visualization", "1", {packages:["columnchart"]}); 
google.setOnLoadCallback(drawChart); 
function drawChart() 
{ 
  var data = new google.visualization.DataTable();
  data.addColumn('string', 'Department'); 
  data.addColumn('number', 'Department'); 
  data.addRows(ColValue.length);
  for (i=0; i<ColValue.length; i++)
  {
   data.setValue(i, 0, ColName[i]);
   data.setValue(i, 1, parseInt(ColValue[i]));
  }
  var chart = new google.visualization.ColumnChart(document.getElementById('chart_div')); 
  chart.draw(data, {width: 600, height: 240, is3D: true, title: 'Graph Title'}); 
} 
</script>

<div id="chart_div" align="center"></div>


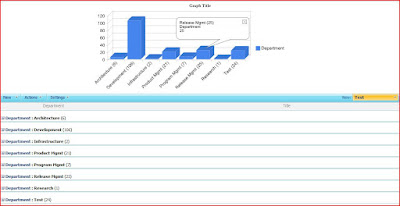
5. You will see the error message: Internet Explorer cannot display the WebPage. Ignore the message and remove the ?PageView=Shared from URL and refresh the page. You should be able to see the chart as follows:
Wednesday, March 10, 2010

Attachments in DataView


By Dafault DataView control dont display attachments and when you add attachment column it displays true/false.


Here is the solution by Brandt Fuchs: http://dbweb.sbisite.com/blogs/bf/Lists/Posts/Post.aspx?ID=19

Perform following steps:

1. Add DataView control in your page.
2. Add an empty column.
3. Add following code:


Monday, March 8, 2010

Adding JavaScript to SharePoint Form Field


Many time in my current project I felt the need of adding javascript to the SharePoint Form Fields to trigger my custom function in order to perform some calculation and other stuff.
Luckily I found the following blog and it sloved my Javascript problem.

URL: http://webborg.blogspot.com/2008/04/add-functions-and-events-to-sharepoint.html

When you add the javascript mentioned in the above blog in the bottom of your page, do call your custom function again at the end because if ur page postbacks and reload (due to some missing required field or any other reason) dropdown change event wont fire. So here is the updated code:

function getField(fieldType,fieldTitle) { 
    var docTags = document.getElementsByTagName(fieldType); 
    for (var i=0; i < docTags.length; i++) { 
        if (docTags[i].title == fieldTitle) { 
            return docTags[i] 
        } 
    } 
} 
 
function DisplayMessage()
{
 alert('Hello World');
}

//Add JavaScript to Decision Column
getField('select','Decision').onchange = function() {DisplayMessage()};

//Add additional call
DisplayMessage();
Line 19 is the additional call to the function.
Above code will add onchange event to choice type SharePoint field and each time the selected value is changed, DisplayMessage() will be triggered.


Wednesday, December 16, 2009

SharePoint 2010 - List Relationship

Today, I got the access to the SharePoint 2010 Beta and guess what I saw? The most beautiful thing that could happen to the SharePoint lists...Relationships. Just like Database relations. :o)

Lets take a look at the following screen shot: While creating a lookup column in a list, I noticed following enhancements:

  1. I can choose ID Column from the parent list.Very very important for building reports/views.
  2. If I choose other column (Title etc), I still can include ID as an additional field.
  3. Restrict & Cascade delete option. :o) If I choose restrict and want to delete parent item, having child items...it will not allow me to do so. If I choose cassade and want to delete parent item...it will delete all the child items along with the parent.

SharePoint 2010 Lists rock!

Friday, December 11, 2009

Join Lists Using SharePoint Designer 2007

Background:
There is no parent-child relationship support in MOSS 2007 lists by default. But as a developer, we all know it is the most common functionality while storing and displaying the data. Following is the technique that I discovered somewhere on the internet to display the data using DataView Control in SharePoint Designer(while developing reports for my last project), but unfortunatily I lost the original source and thought to reproduce it in my blog with some enhancements.

Implementation:
Following are the steps to perform Inner Join on two lists using DataView Control in SharePoint Designer:

1. We need following two lists(with data in them):
  • Department (ID, Title)
  • Student (ID,Department_x0020_ID, Title)


  • 2. Open SharePoint Designer and create a new ASPX page.

    3. Create a linked datasource by following steps:
    1. Select Create a new Linked Source... from Data Source Library tab.

    2. In Data Source Properties dialog, select Configure Linked Source... button.

    3. From Link Data Sources Wizard, select Students and Department Lists and hit Next.

    4. Choose Join the contents... option and select Finish.

    5. Then select OK to get the New Data Source.

    6. Expand the New Data Source and select Show Data option.

    7. Under Data Source Details tab, you should see both lists (Department and student).


    4. Insert a Data View control into the ASPX page.
    5. Under Data Source Details tab, expand the Students list and drag and drop the Title column to Data View control and it will display all the students.
    6. Now place your cursur in Title column and select Table -> Insert -> Column to Right. In this column we will display Department.Title.
    7. Place your cursor on the first row of new column, select Title Column from Department list and select the Insert selected field as... button and choose Joined Subview opion.
    8. In Join Subview dialog, select Department_x0020_ID = ID and hit OK. (Pic 12)
    9. Thats it :o).
    10. Play with the HTML to make it look like a report.

    Sunday, November 15, 2009

    Get the actual error message in SharePoint Site Page


    In web.config change the following:

    1. CallStack="false"

    2. <customErrors mode="On" />

    Now refresh the page to see the actual ASP.NET error message.

    Before:


    After:

    Official SharePoint Documentation

    I have recently contributed to the official SharePoint documentation for developement. Check it out here: https://docs.microsoft.com/en-us...