Pre Requisite: This article assumes that following components are installed on the Windows Server:
- SharePoint 2007
- SQL Server 2005
- Visual Studio 2005/2008
- SQL Server Reporting Service 2008
With the installation of SSRS 2008, following two virtual directories will be created under default website in IIS:
- Reporting Server: http://localhost/ReportServer
- Reports Manager: http://localhost/Reports (We will be using this)
You can get configuration information about SSRS by launching Reporting Services Configuration Manager from Start menu.
Let's create a report now.
Let's create a report now.
- Launch SQL Server Business Intelligence Development Studio from Start menu.

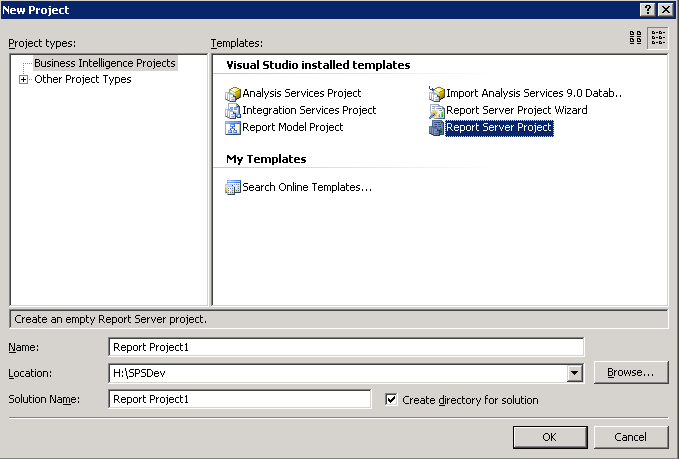
- Select File -> New -> Project and select Report Server Project.
- Once the project is created, you will see two folders: Shared Data Sources and Reports. I don't need to explain these two folders...right? :o).

- Create Data Source: In this step we have to define that our data source is a SharePoint 2007 List and we will connect to that list using SharePoint web services.
Add New Data Source by r-clicking the Create Data Sources folder and specify the name as SharePointDataSource, type as XML and Connection string as https://<sharepointsite>/_vti_bin/lists.asmx
- Create Report: We have a custom list List9 in our SharePoint Site which we want to show in the report. Here is how the data in List9 looks like:
 R-click Reports folder and select Add New Report. This will launch Report Wizard. In the Report Wizard specify the data source (SharePointDataSource) created in the step 4 here.
 - Publish: Lets publish the report on the Reporting Manager/Server.
Go to the project folder and upload Report1.rpt and SharePointDataSource.rds files to http://localhost/Reports. I have renamed my datasource file to ds_SPList on the Reporting Server.
Click Report1 and you should see the data from SharePoint List 9.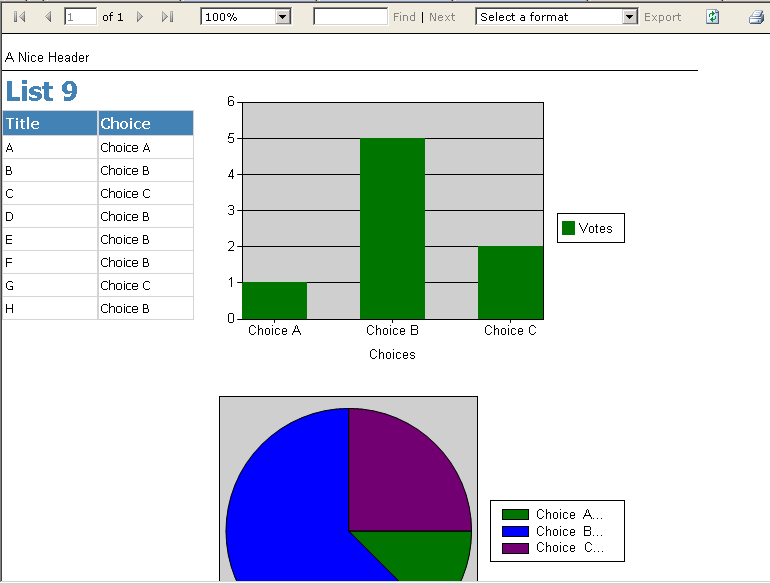

In the next screen provide the Query String specifying the List Name and columns etc.

Here is a sample XML:
<Query>
  <SoapAction>http://schemas.microsoft.com/sharepoint/soap/GetListItems</SoapAction>
  <Method Namespace="http://schemas.microsoft.com/sharepoint/soap/" Name="GetListItems">
      <Parameters>
         <Parameter Name="listName">
            <DefaultValue>List9</DefaultValue>
         </Parameter>
         <Parameter Name="viewName">
            <DefaultValue></DefaultValue>
            <ViewFields>
               <FieldRef Name="Title" />
               <FieldRef Name="Choice" />
            </ViewFields>
         </Parameter>
      </Parameters>
   </Method>
   <ElementPath IgnoreNamespaces="True">*</ElementPath>
</Query>

In the next screen, under Details add ows_Title and ows_Choice columns.

In the next screen select the Table Style

hit last Next and then Finish.

You will see your first report as follow

Hit Preview tab to run the report and see the data from List9 list from SharePoint.

Now is the time to make report pretty e.g. change title, add graphs or add additional columns.


No comments:
Post a Comment