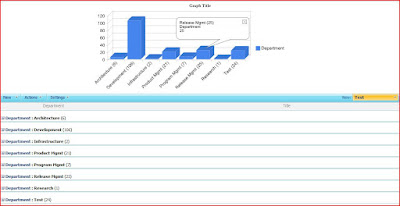
I have extended the same technique (JavaScript) to display the Interactive Google Charts based on the SharePoint Data without writing any code :o). The javascript code uses JQuery and Google Interactive Charts (aka Visualization API).
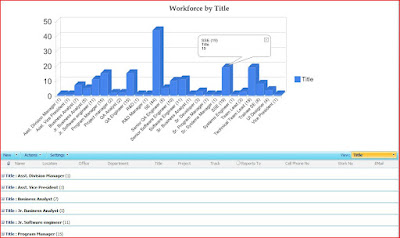
You need to perform following steps:
1. Create a new SharePoint List View.
2. Group the data by a Column e.g. Title.
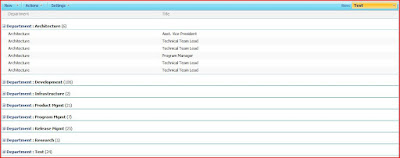
3. Add Content Editor WebPart
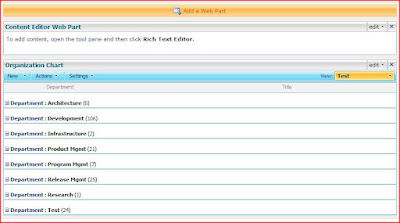
4. Select Edit-> Modify Shared WebPart -> Source Editor and paste the following JavaScript:
<!--
Author: Tahir Naveed
Date: 2010-04-15
Article URL:http://mysplist.blogspot.com/2010/04/intractive-sharepoint-charts-with-no.html
Blog URL: http://mysplist.blogspot.com/
Original Code: http://www.endusersharepoint.com/2009/04/29/finally-dynamic-charting-in-wss-no-code-required-part-3-multiple-pie-charts
-->
<SCRIPT type=text/javascript>
if(typeof jQuery=="undefined")
{
    var jQPath="http://ajax.googleapis.com/ajax/libs/jquery/1.3.2/";
    document.write("<script src='",jQPath,"jquery.js' type='text/javascript'><\/script>");
}
</SCRIPT>

<script type="text/javascript" src="http://www.google.com/jsapi">
</script>

<SCRIPT type=text/javascript>
var ColValue = new Array();
var ColName = new Array();

// Getting the Data
$("document").ready(function(){
 var arrayList=$("td.ms-gb:contains(':')");
 var coord= new Array();
 var labels= new Array();
 $.each(arrayList, function(i,e)
 {
  var MyIf= $(e).text();
  var txt= MyIf.substring(MyIf.indexOf('(')+1,MyIf.length-1);
  // Extract the 'Y' coordinates
  coord[i]=txt;
  var txt1= MyIf.substring(MyIf.indexOf(':')+2,MyIf.indexOf("(")-1);
  // Extract the labels
  labels[i]=txt1+"("+txt+")";
  //add also coordinates for better read
 });
 ColValue = coord;
 ColName = labels;
 });

//Graph Rendering
google.load("visualization", "1", {packages:["columnchart"]});
google.setOnLoadCallback(drawChart);
function drawChart()
{
  var data = new google.visualization.DataTable();
  data.addColumn('string', 'Department');
  data.addColumn('number', 'Department');
  data.addRows(ColValue.length);
  for (i=0; i<ColValue.length; i++)
  {
   data.setValue(i, 0, ColName[i]);
   data.setValue(i, 1, parseInt(ColValue[i]));
  }
  var chart = new google.visualization.ColumnChart(document.getElementById('chart_div'));
  chart.draw(data, {width: 600, height: 240, is3D: true, title: 'Graph Title'});
}
</script>

<div id="chart_div" align="center"></div>
5. You will see the error message: Internet Explorer cannot display the WebPage. Ignore the message and remove the ?PageView=Shared from URL and refresh the page. You should be able to see the chart as follows: